 Home
Home
 Get Link

 Share on X
 Share on Facebook
 Share on LinkedIn
 Share by Email

 Suggestion successfully sent!
  Sorry, we couldn't process your suggestion
 Overview
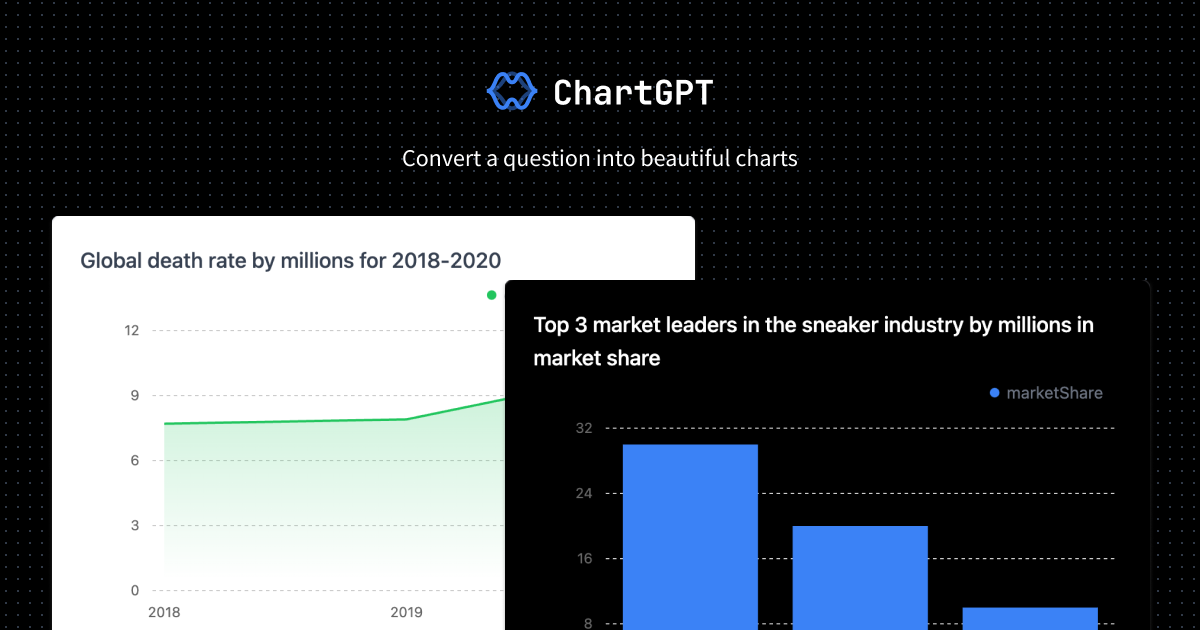
ChartGPT is an AI-powered chart and data-visualization assistant that converts natural-language prompts into clear, shareable charts and summaries for business, research, and presentations.
Key Features:
- Natural-language to chart generation (bar, pie, line, map) from plain prompts
- Prebuilt templates for market share, distributions, and trends with customizable parameters
- Exportable visuals and data (PNG, SVG, CSV) with automatic labeling and summaries
Use Cases:
- Compare top market leaders by market share for competitive analysis
- Visualize energy-source distributions or demographic percentages for reports
- Create global or city-level climate and rainfall comparisons for research or presentations
Benefits:
- Saves time by turning text queries into publication-ready charts instantly
- Makes data accessible to non-technical users through simple prompts and templates
- Improves decision-making with clear visual insights and exportable data
 Sign in with Google
Add your comments